Communicating Risk

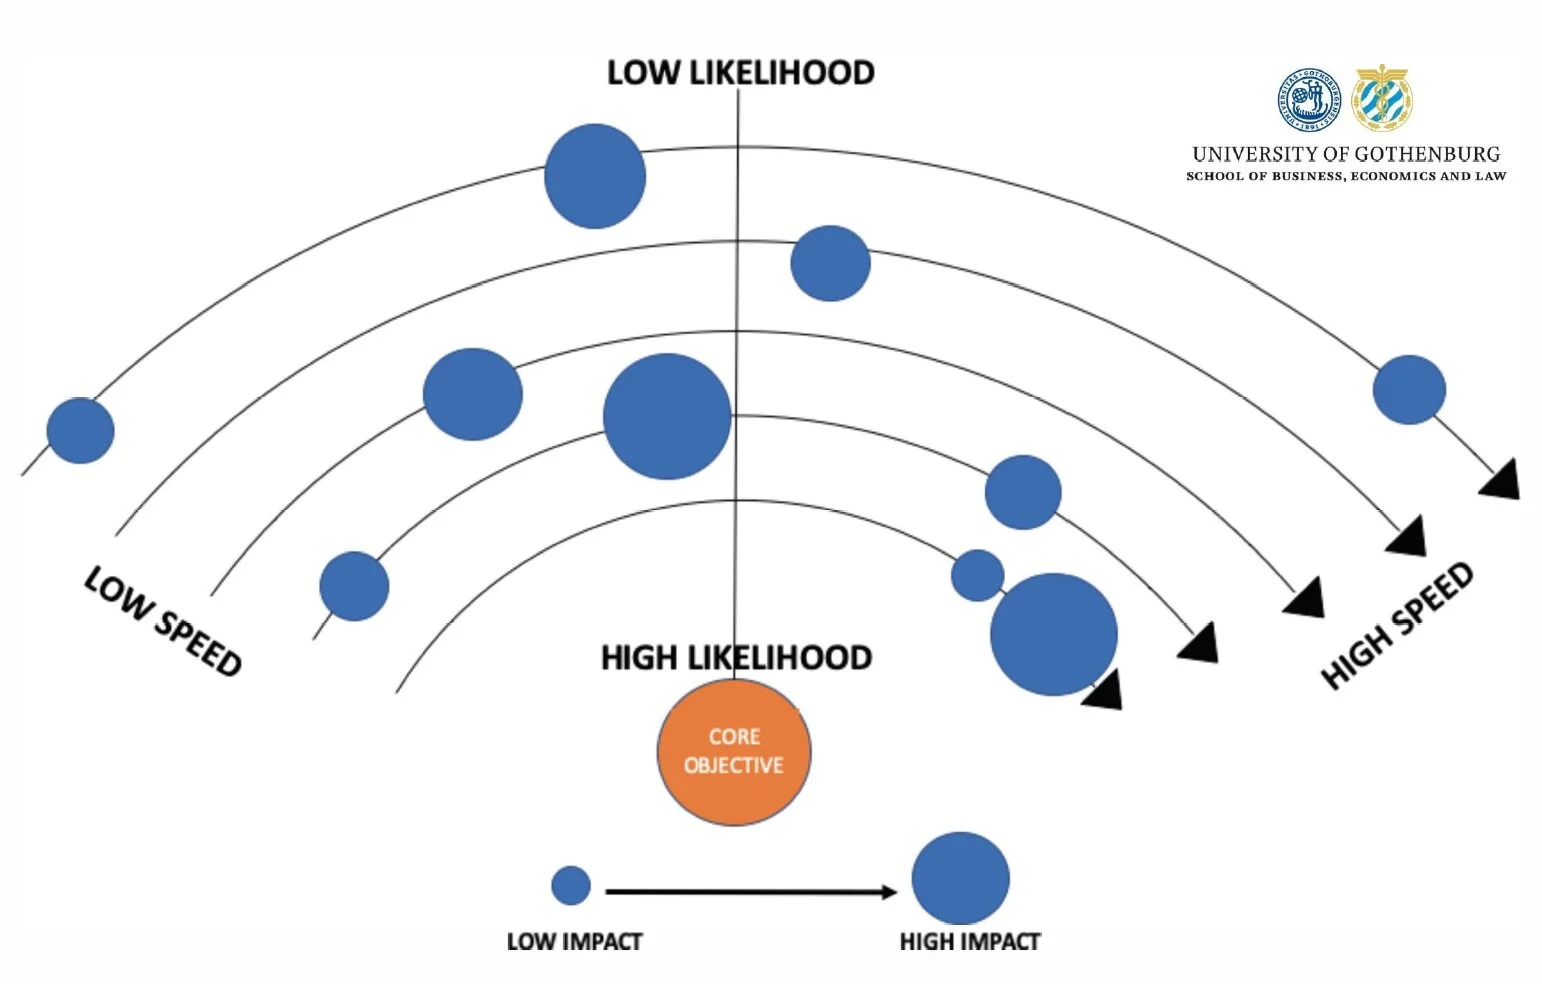
Source: Risk Assessment in Practice, COSO, 2012
There has been some discussion about heat maps and their usefulness. I don’t think the heat map in and of itself is problematic, I mean impact and likelihood are foundations to measuring risk and prioritizing. It is possible to include other parameters of risk in a heat map - for example the one pictured here from a COSO thought paper includes speed of onset and vulnerability in addition to the traditional likelihood and impact.
What I think IS a problem behind the use of a heat map is that those using it forget the fundamentals behind it. For example, the colors in the heat map “green”, “yellow” and “red” are not arbitrary, they shouldn’t look the same for every company, they don’t have to be distributed evenly across the map, etc. The colors should represent the risk appetite of the firm. Why then do most look uniform? Some companies even remove the colors as they are afraid to place a risk in the “red”. Well, if you don’t feel the need to communicate it as “red” then maybe it isn’t supposed to be red - maybe your risk appetite is higher? And what about the larger problem of the culture of “fearing” red risks? Isn’t the intention to communicate important matters, not disguise them as something they aren’t?
And I would guess most companies have one heat map. But aren’t we concerned about the impact of risks on different objectives? Perhaps we have a financial objective but also a market growth objective. For a given risk there may be a high impact on one objective and low impact on another. So couldn’t one way for the board or management to think about risk in a new way be to produce heat maps addressing different objectives? Maybe that could be an eye opener.
Of course, there are a number of other parameters of risk that may be important to communicate. I had the students on my ERM course in the Accounting and Financial Management Master’s program in Gothenburg make a list of all the parameters they could think of that we had covered in class. Here is what they came up with:
impact
likelihood
uncertainty in measurement
external / internal
controllability
mitigation activity
mitigation cost
prevention
root cause
speed of change
changes over time / trends
short-term / long-term
related KRIs
core / non-core
strategic risk
relation to objectives
risk capacity
risk appetite
risk / reward tradeoff
firm-wide / dept. specific
scenarios of risk
relation to target performance
quantitative / qualitative
risk owner
Then I asked them to create a new “heat map” using some of these parameters. They shared their posters with their ideas on how to communicate important risk information to the board at our ERM event. The groups highlighted the importance of connection/correlation between risks, speed of onset, and link to strategic initiatives. Check out their posters below!